Vulnerability Assessment of Residential Houses Against Tropical Cyclonic Winds
This website focuses on the methods and results of the vulnerability assessment of residential buildings in selected barangays of Limasawa Island against tropical cyclonic winds using Geographic Information System (GIS) and Analytic Hierarchy Process (AHP)
Civil Engineering Project of Team AHP Limasawa
ABSTRACT
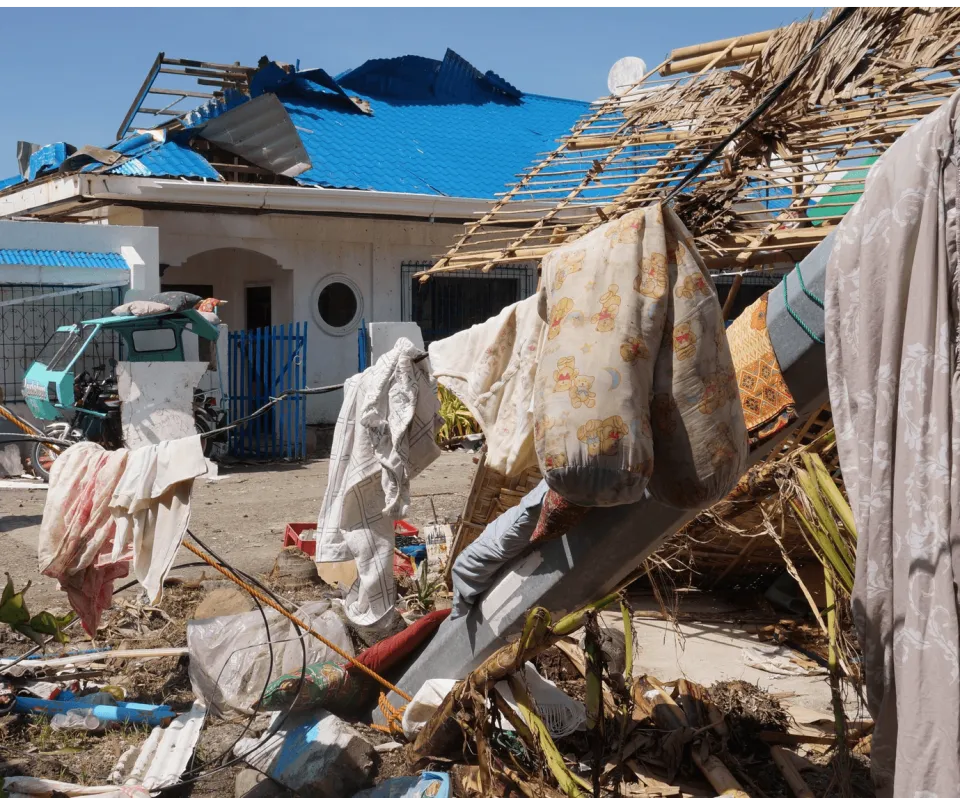
Limasawa Island is one of the most affected municipalities due to Supertyphoon Odette last December 16, 2021. Being an island municipality makes it more vulnerable to cyclones, specifically to the strong winds it brought. The study covers only three barangays: San Agustin, Triana, and Magallanes. This study generally aims to develop a tropical cyclone wind vulnerability map through vulnerability assessment of residential houses using Geographical Information System (GIS) and Analytic Hierarchy Process (AHP). The vulnerability assessment against cyclonic winds includes nine parameters: structural framing material, roof type, roof material, elevation, proximity to coastline, proximity to cyclone track, wind speed, cyclone frequency, and presence and number of obstructions. Each parameter has its own map layer, the relative weight of each parameter was analyzed using the AHP with the aid of the selected experts’ judgments. The weights were used to produce the cyclonic wind vulnerability maps per barangay through the weighted overlay tool in QGIS. Sensitivity analysis was performed to validate the results of the study. The results show that residential houses in the three barangays have between low and moderate vulnerability to cyclonic winds. Houses under low vulnerability range from 73% to 87% of the houses per barangay. Meanwhile, only 13% to 27% of the houses per barangay falls under moderate vulnerability against cyclonic winds.
Experience how it's like to be one of our experts
28.05.2024
4
minJoshua Galo
Our evaluation process for each attribute was carefully crafted with input from experts in Wind Characteristics, Meteorology, Structural Engineering, GIS Mapping, City Planning and Development, and Disaster Risk Reduction and Management, resulting in a comprehensive and well-rounded set of criteria.
Are you interested to rank and compare the parameters of this study?
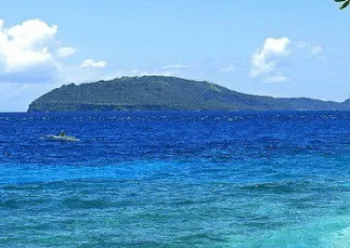
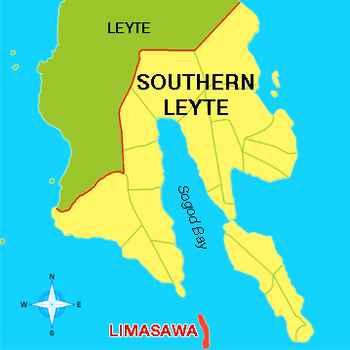
The Study Area: Limasawa Island
28.05.2024
7
minDevenah Dawn Dagohoy
The study covers only three out of six barangays on the island. The barangays included in this study were selected in terms of their geographical location; facing west is Barangay Triana, east and south as represented by Barangay Magallanes, and Barangay San Agustin for the north.
Let's create maps!
28.05.2024
7
minJarrod Bee Nuñez
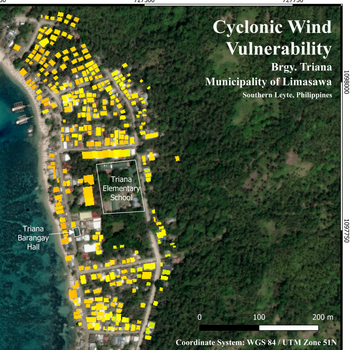
The maps generated in this study were processed using the Quantum GIS (QGIS) software. An essential tool for disaster risk reduction and management is hazard mapping. It involves finding and assessing locations vulnerable to different natural hazards. These maps offer valuable data for development, planning, and disaster relief.
Sensitivity Maps
28.05.2024
12
minMiles Costillas
Sensitivity analysis (SA) plays a vital role in validating and calibrating numerical models. It serves as a valuable tool to assess the robustness of the outcomes against minor variations in input data (Chen, Yu, Shahbaz, & Xevi, 2009). The analysis in this study includes 27 schemes, as shown in the table below. The classification has five values; the lowest number indicates houses with very low vulnerability. Each parameter was given three variations in weight, respectively 10%, 30%, and 60%, adopted from the case study of Primawan (2023).
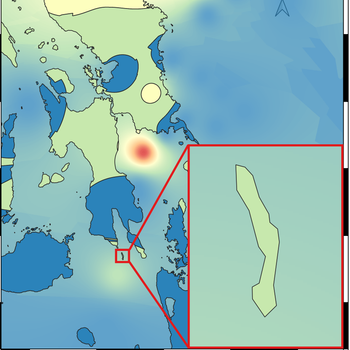
Cyclonic Vulnerability Maps
28.05.2024
10
minDevenah Dawn Dagohoy
The overlay analysis tool in QGIS was used to add each criterion layer with its corresponding weights. The final cyclonic wind vulnerability map is classified into five vulnerability classes: Very Low Vulnerability, Low Vulnerability, Moderate Vulnerability, High Vulnerability, and Very High Vulnerability, as shown in the figures below. The findings revealed that the houses of the selected barangays in Limasawa Municipality exhibit low to moderate vulnerability to tropical cyclonic winds.
Parameter Maps
28.05.2024
12
minDevenah Dawn Dagohoy
Cyclonic wind vulnerability parameters were mapped using QGIS using the established feature weight of each parameter. The study generated 17 parameter maps and three cyclonic wind vulnerability maps. All the building attributes and the presence and number of obstructions were mapped per barangay, while the remaining location attributes presented the whole municipality.
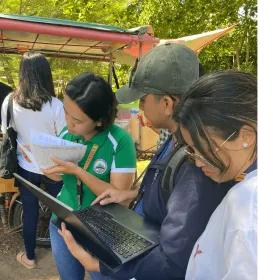
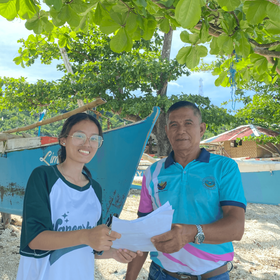
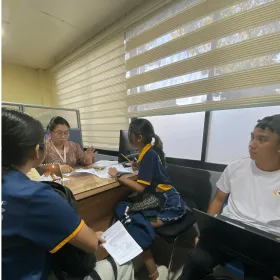
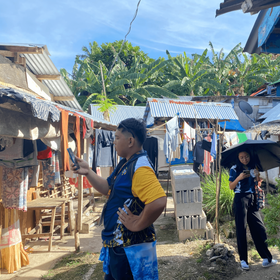
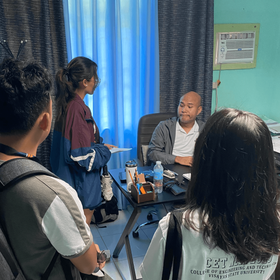
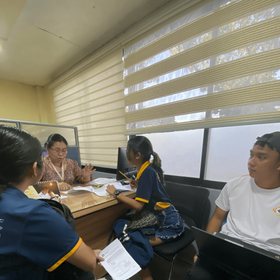
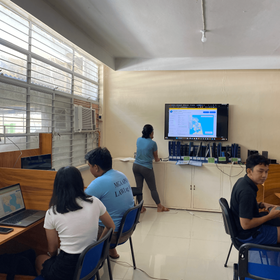
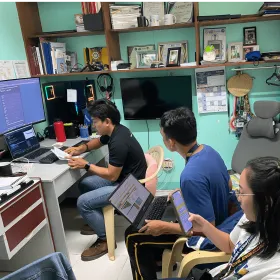
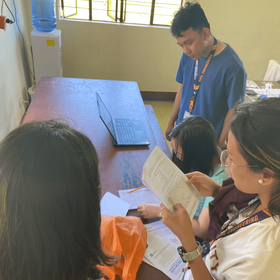
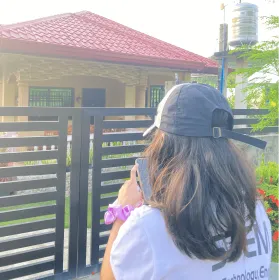
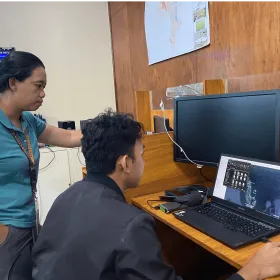
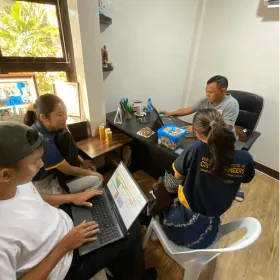
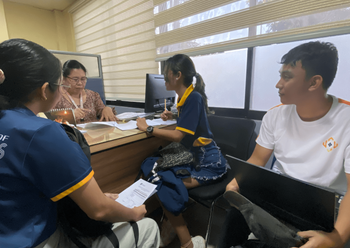
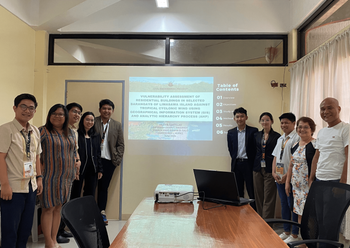
DOCUMENTATIONS