Sensitivity Maps
By:
Miles Costillas
On
28/05/2024Reading time:
12 min
Summary:
Sensitivity analysis (SA) plays a vital role in validating and calibrating numerical models. It serves as a valuable tool to assess the robustness of the outcomes against minor variations in input data (Chen, Yu, Shahbaz, & Xevi, 2009). The analysis in this study includes 27 schemes, as shown in the table below. The classification has five values; the lowest number indicates houses with very low vulnerability. Each parameter was given three variations in weight, respectively 10%, 30%, and 60%, adopted from the case study of Primawan (2023).
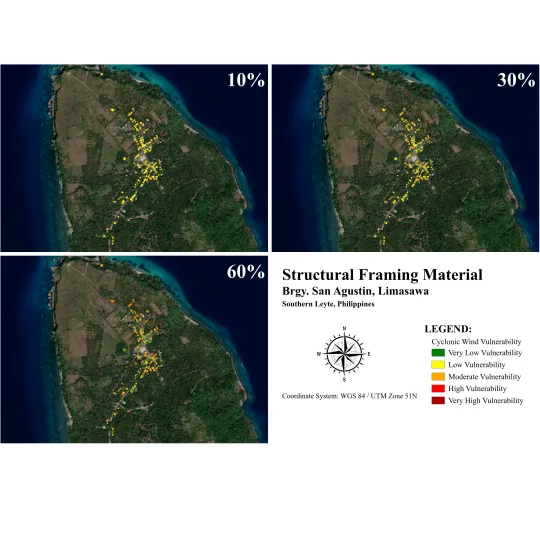
Structural Framing Material Sensitivity Maps of Brgy. San Agustin
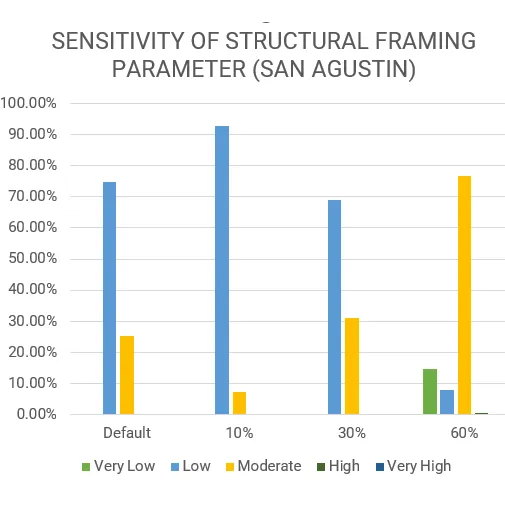
Sensitivity Graph of SMF (San Agustin)
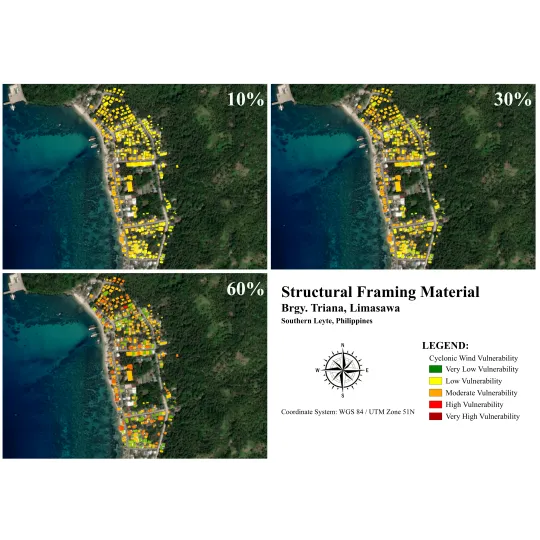
Structural Framing Material Sensitivity Maps of Brgy. Triana
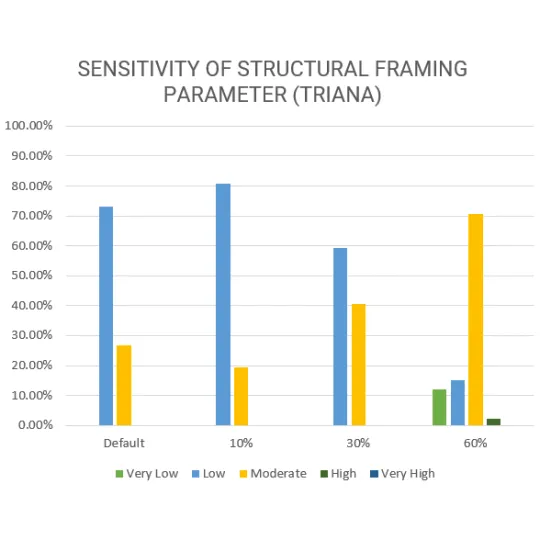
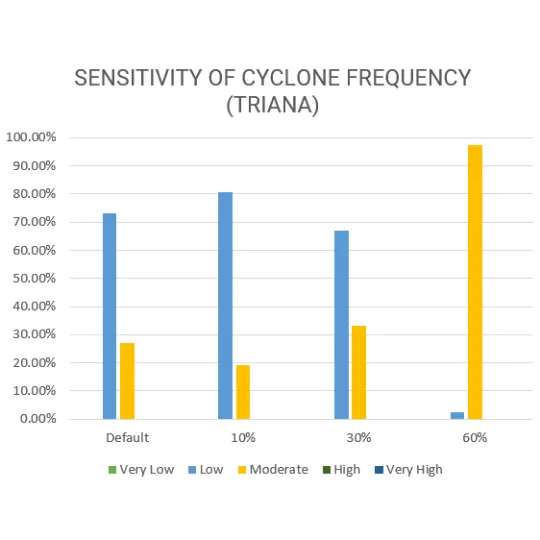
Sensitivity Graph of SMF (Triana)
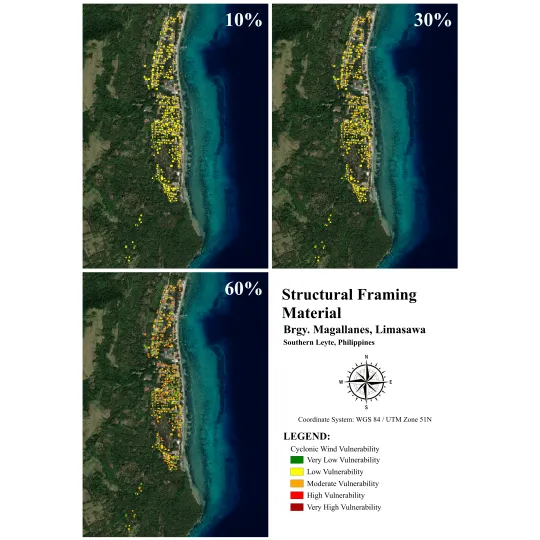
Structural Framing Material Sensitivity Maps of Brgy. Magallanes
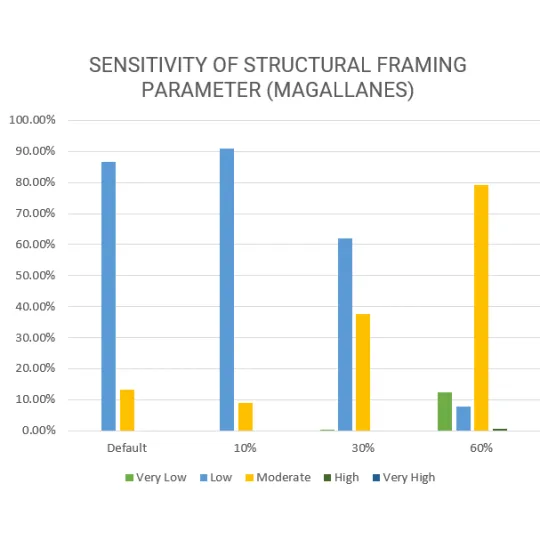
Sensitivity Graph of SMF (Magallanes)
Structural Framing Material Sensitivity Maps and Graphs
A significant change can be seen when the weights of the structural framing material parameter are shifted to different values. As shown in the graphs per barangay, a decrease in the percentage of houses under low vulnerability can be seen as the parameter’s weight increases. From a range of 73% to 87% in the default map down to only less than 15% across all barangays when the weight was increased to 60%. Consequently, in the 60% weight, there are houses categorized as very low and high vulnerability to cyclonic winds.
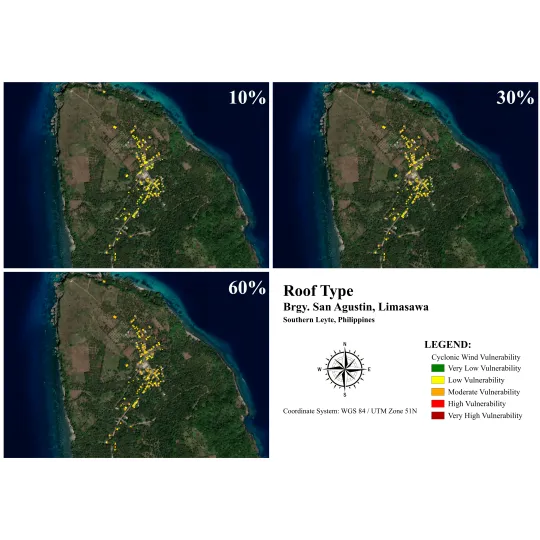
Roof Type Sensitivity Maps of Brgy. San Agustin
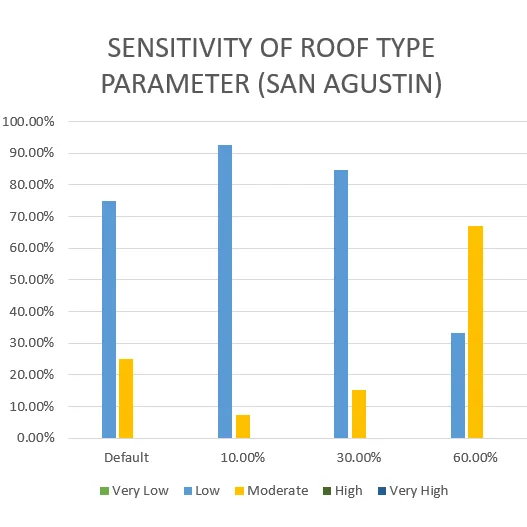
Sensitivity Graph of Roof Type (San Agustin)
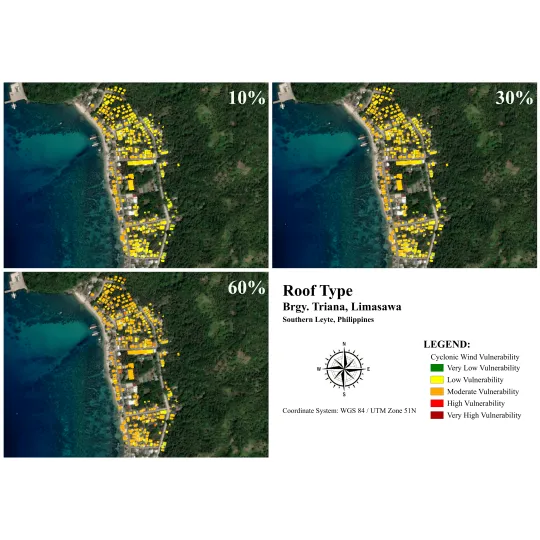
Roof Type Sensitivity Maps of Brgy. Triana
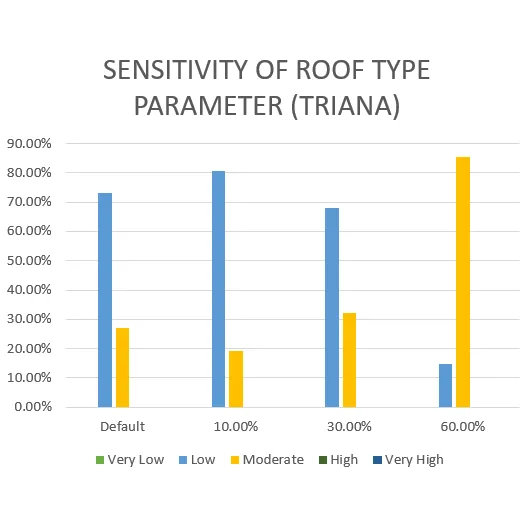
Sensitivity Graph of Roof Type (Triana)
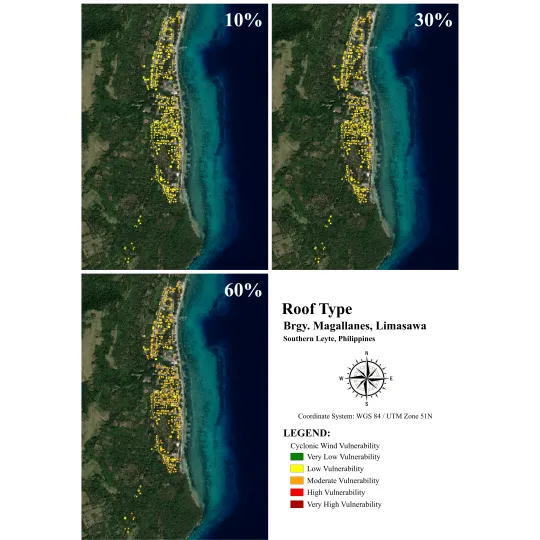
Roof Type Sensitivity Maps of Brgy. Magallanes
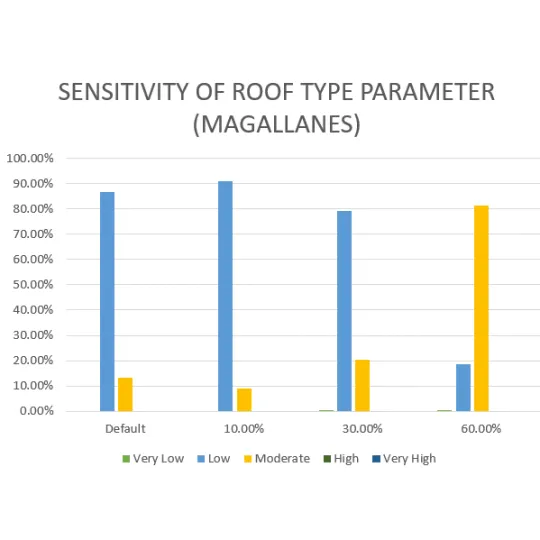
Sensitivity Graph of Roof Type (Magallanes)
Roof Type Sensitivity Maps and Graphs
The figures above show the cyclonic vulnerability map and the results of data processing changes in weight values for the roof type parameter. Here, as the weight value is increased, the number of houses classified under low vulnerability decreased, while the number of moderately vulnerable houses increased. From the sensitivity graph of Brgy. San Agustin, low vulnerability class decreased from 93% to 33% and moderate vulnerability increased from 7% to 67%. This trend is consistent across all barangays with varying percentages.
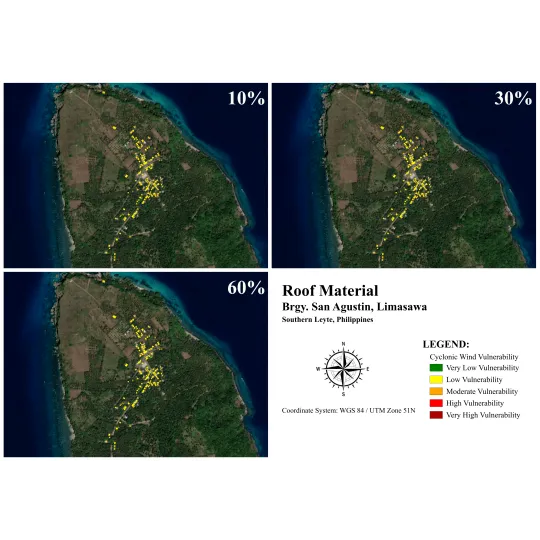
Roof Material Sensitivity Maps of Brgy. San Agustin
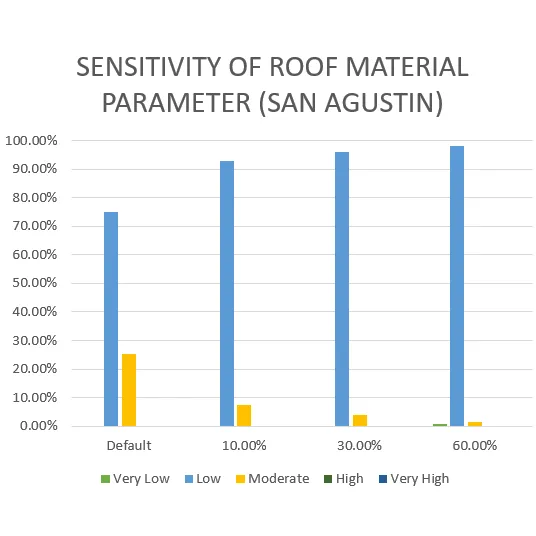
Sensitivity Graph of RM (San Agustin)
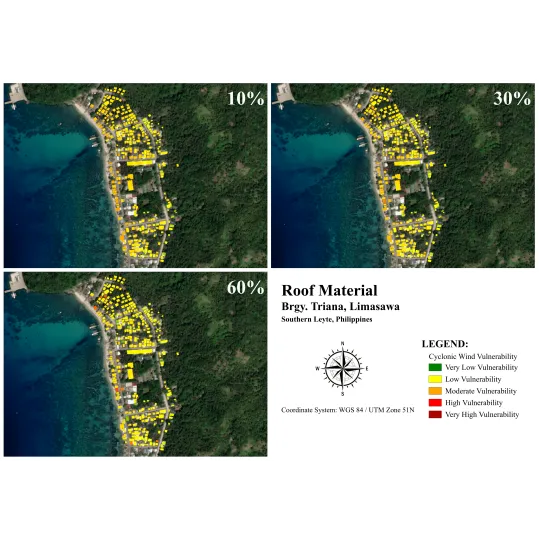
Roof Material Sensitivity Maps of Brgy. Triana
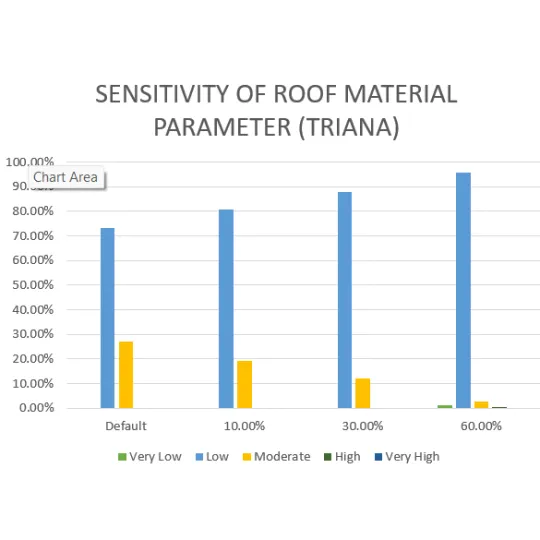
Sensitivity Graph of RM (Triana)
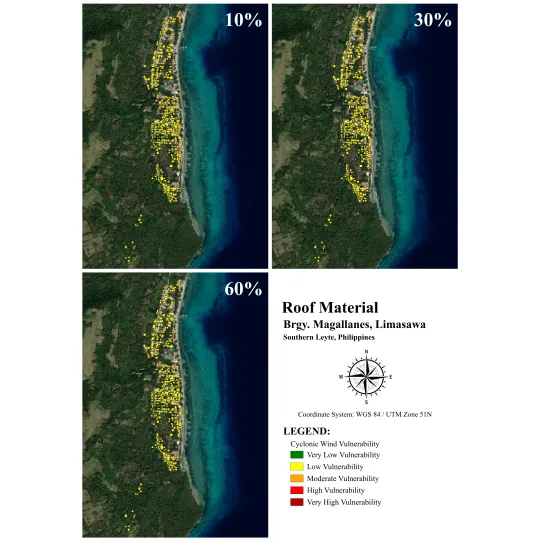
Roof Material Sensitivity Maps of Brgy. Magallanes
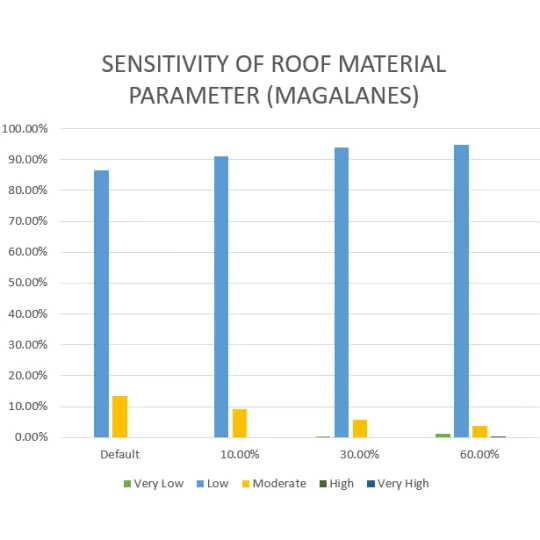
Sensitivity Graph of RM (Magallanes)
Roof Material Sensitivity Maps and Graphs
The figures below show that as the weight value increased, the number of houses classified under low vulnerability increased, while the number of moderately vulnerable houses decreased. From the sensitivity graph of Brgy. Triana, low vulnerability class increased from 81% to 96% and moderate vulnerability decreased from 19% to 3%. This trend is consistent across all barangays with varying percentages.

Elevation Sensitivity Maps of Brgy. San Agustin
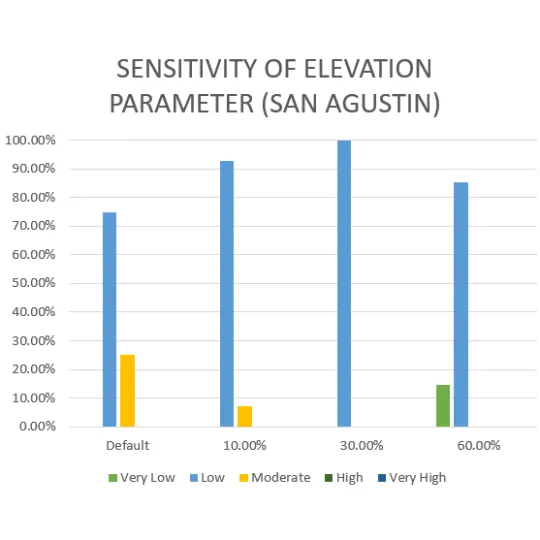
Sensitivity Graph of Elevation (San Agustin)
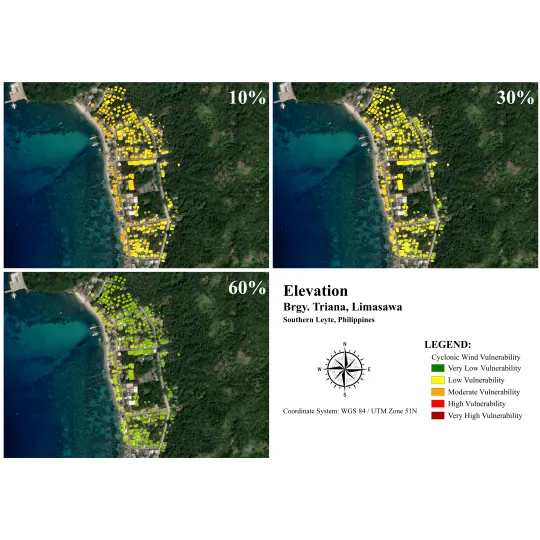
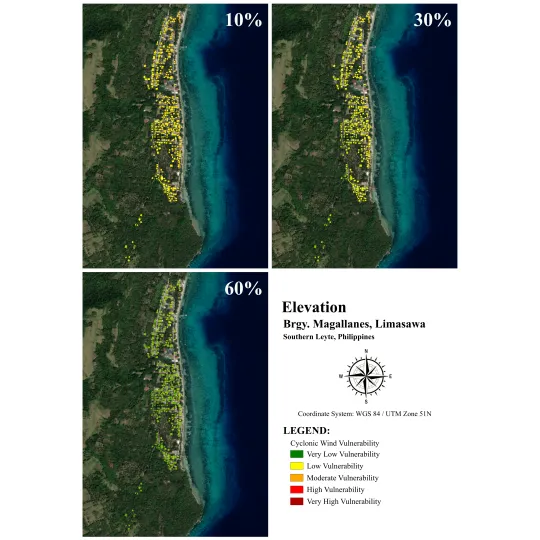
Elevation Sensitivity Maps of Brgy. Triana
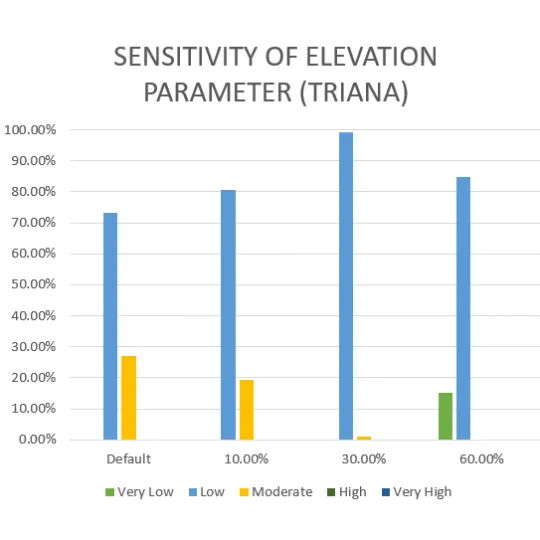
Sensitivity Graph of Elevation (Triana)
Elevation Sensitivity Maps of Brgy. Magallanes
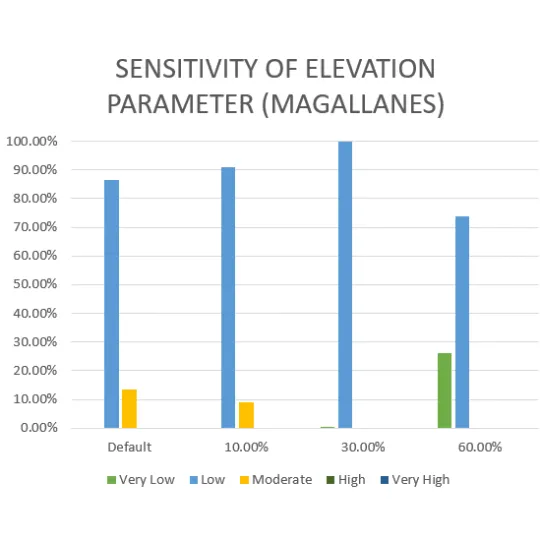
Sensitivity Graph of Elevation (Magallanes)
Elevation Sensitivity Maps and Graphs
The figures show that as the weight value increased, the number of houses classified under low vulnerability increased, while the number of moderately vulnerable houses decreased. From the sensitivity graph of Brgy. San Agustin, low vulnerability class increased from 93% to 100%. Moreover, a new category of very low vulnerability with 15% emerged. Subsequently, moderate vulnerability decreased to 8%. This trend is consistent across all barangays with varying percentages.
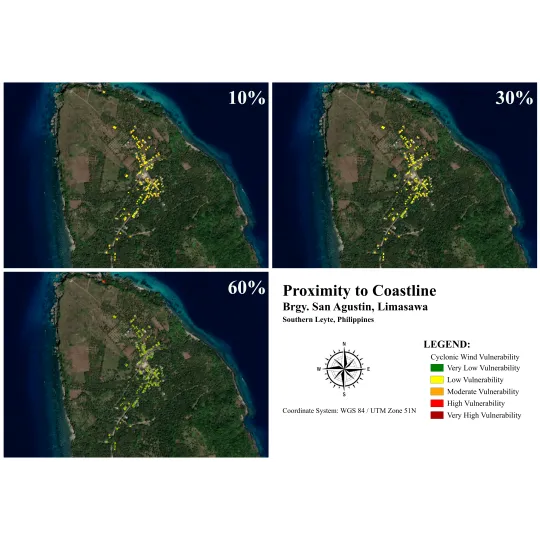
Proximity to Coastline Sensitivity Maps of Brgy. San Agustin
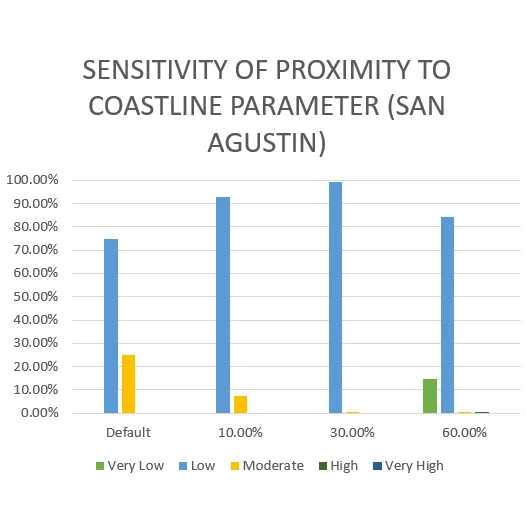
Sensitivity Graph of Proximity to Coastline (San Agustin)
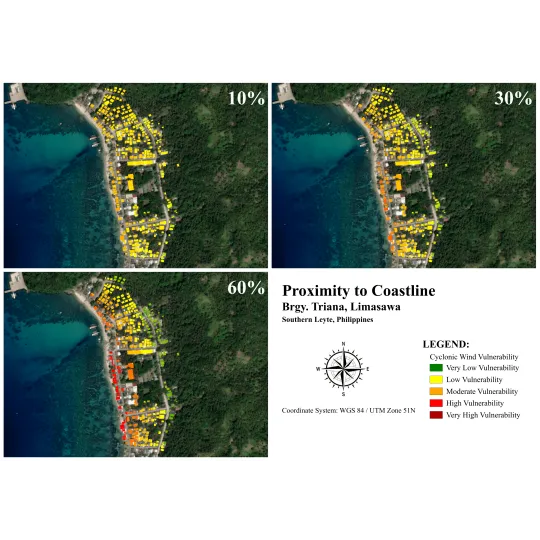
Proximity to Coastline Sensitivity Maps of Brgy. Triana
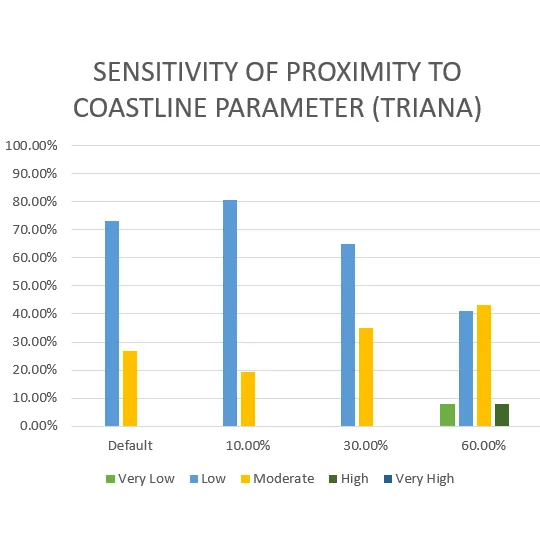
Sensitivity Graph of Proximity to Coastline (Triana)

Proximity to Coastline Sensitivity Maps of Brgy. Magallanes
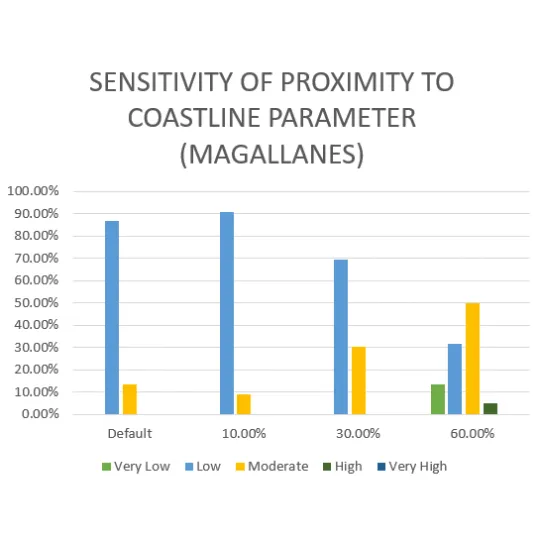
Sensitivity Graph of Proximity to Coastline (Magallanes)
Proximity to Coastline Sensitivity Maps and Graphs
The figures show that as the weight value increased, the number of houses classified under low vulnerability decreased, while the number of moderately vulnerable houses increased. From the sensitivity graph of Brgy. Magallanes, low vulnerability class decreased from 91% to 31%. Moreover, a new category of very low vulnerability emerged with 14%. Moderate vulnerability increased from 9% to 50% followed by the emergence of high vulnerability category with 5%. This trend is consistent across all barangays with varying percentages.

Proximity to Cyclone Track Sensitivity Maps of Brgy. San Agustin
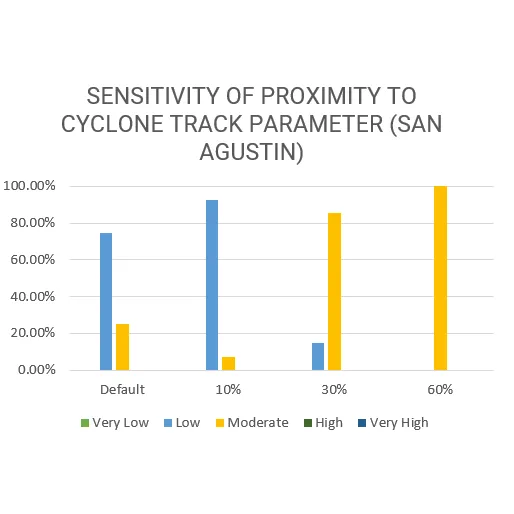
Sensitivity Graph of Proximity to Cyclone Track (San Agustin)
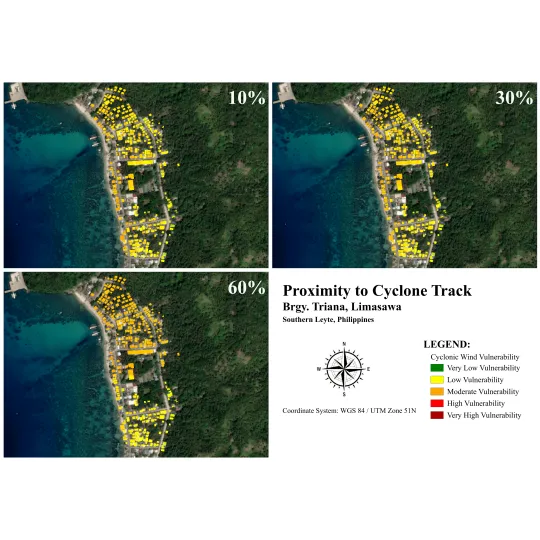
Proximity to Cyclone Track Sensitivity Maps of Brgy. Triana
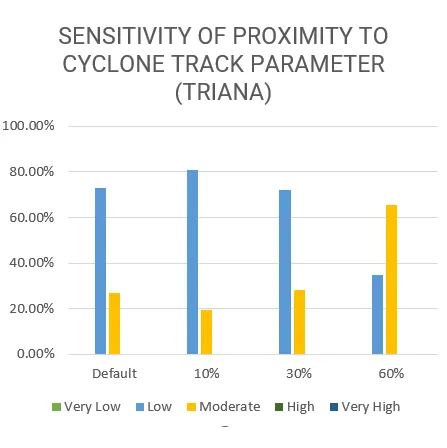
Sensitivity Graph of Proximity to Cyclone Track (Triana)
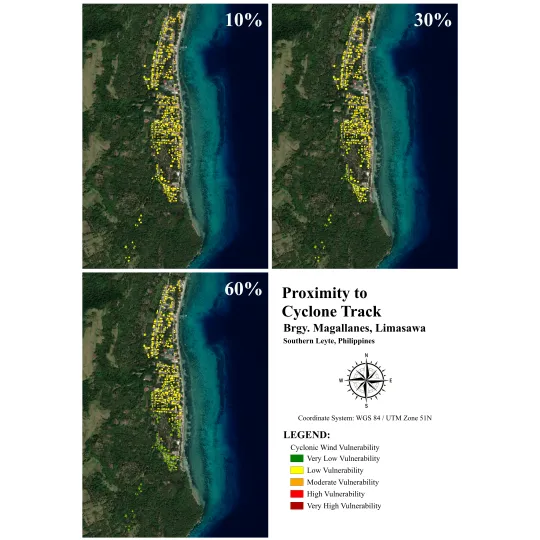
Proximity to Cyclone Track Sensitivity Maps of Brgy. Magallanes
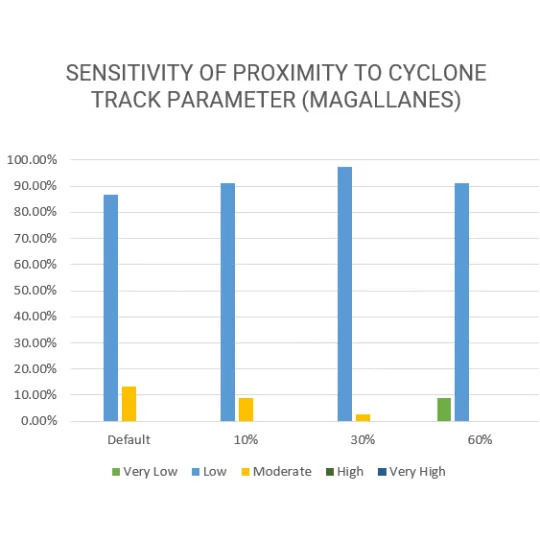
Sensitivity Graph of Proximity to Cyclone Track (Magallanes)
Proximity to Cyclone Track Sensitivity Maps and Graphs
The figures above show the results of data processing changes in weight values for the “proximity to cyclone track” (PCT) parameter on the three Barangays. The results show significant changes in the percentage and type of vulnerability at every location. Both barangay San Agustin and barangay Triana showed a trend of increasing vulnerability as their weight percentage increased (from 10% to 60%). Notably, the former barangay had a drastic change in vulnerability, having 100% moderate vulnerability on all houses when its weight was set to 60% while barangay Triana had 65.44% moderate vulnerability and 34.56% low vulnerability on its residential buildings. On the other hand, Barangay Magallanes showed an opposite trend of decreasing vulnerability where 9.05% of its buildings had very low vulnerability and the other 90.95% had only low vulnerability when its weight was set to 60%, contrasting to its default weight where moderate vulnerability was present.
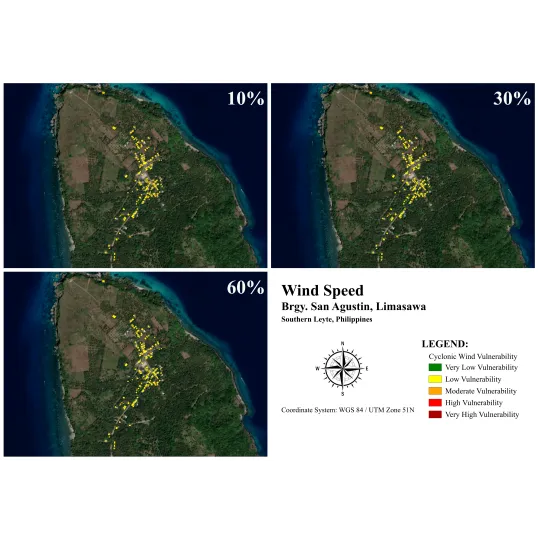
Wind Speed Sensitivity Maps of Brgy. San Agustin
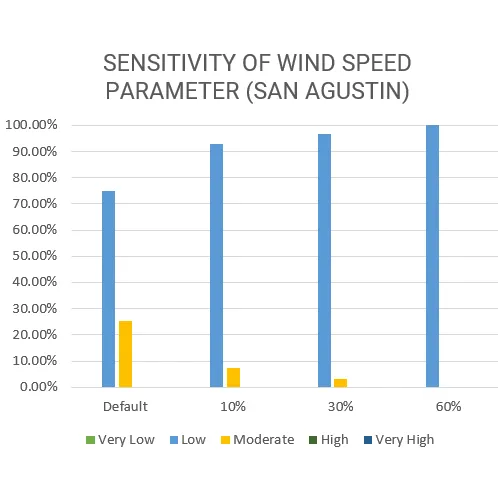
Sensitivity Graph of Wind Speed (San Agustin)

Wind Speed Sensitivity Maps of Brgy. Triana
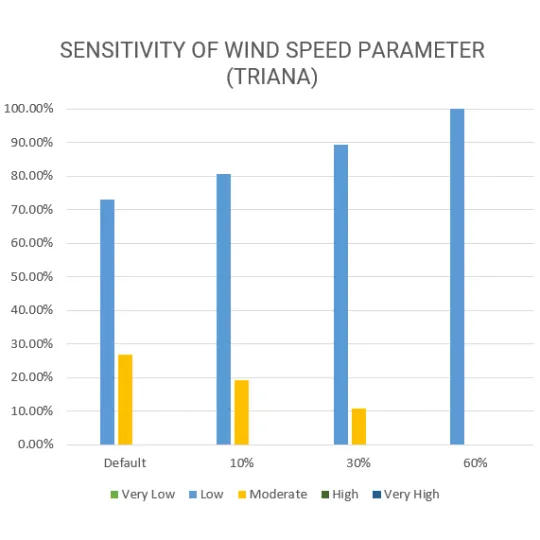
Sensitivity Graph of Wind Speed (Triana)
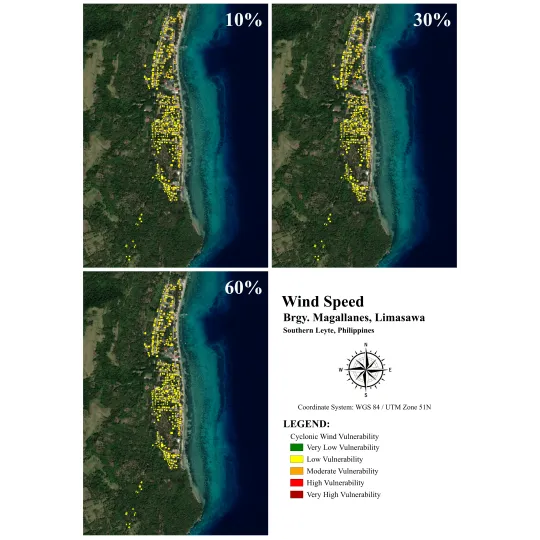
Wind Speed Sensitivity Maps of Brgy. Magallanes
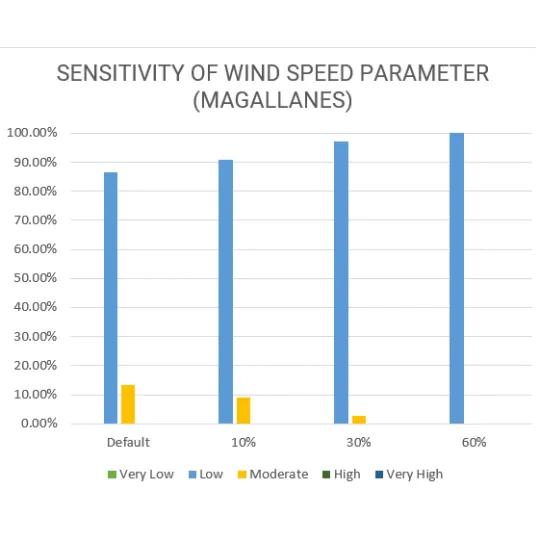
Sensitivity Graph of Wind Speed (Magallanes)
Wind Speed Sensitivity Maps and Graphs
The figures above show the changes in vulnerability of residential buildings when the weight of the “wind speed” (WS) parameter changes from 10% to 60%. A comparison of the vulnerability using the default weight can also be seen. The results showed that when the weight of the parameter was changed from 10% to 60%, there is a small trend of decreasing vulnerability where most of the buildings is leaning low vulnerability when the weight of the parameter was set to 60%. All three of the barangays had 100% low vulnerability on its residential buildings which can be contrasted with the default weights where the moderate vulnerability is visible.
Cyclone Frequency Sensitivity Maps of Brgy. San Agustin
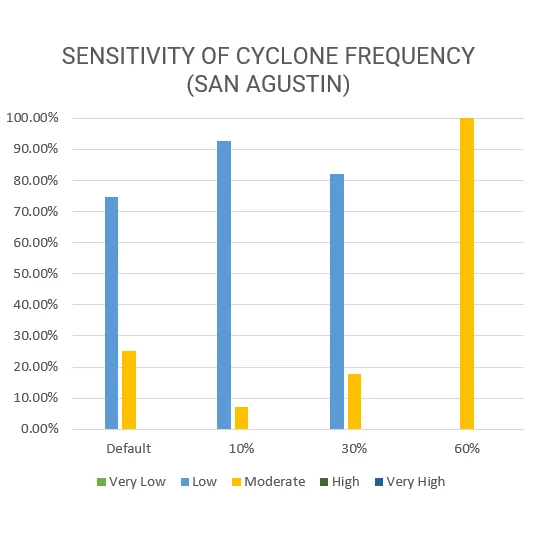
Sensitivity Graph of Cyclone Frequency (San Agustin)
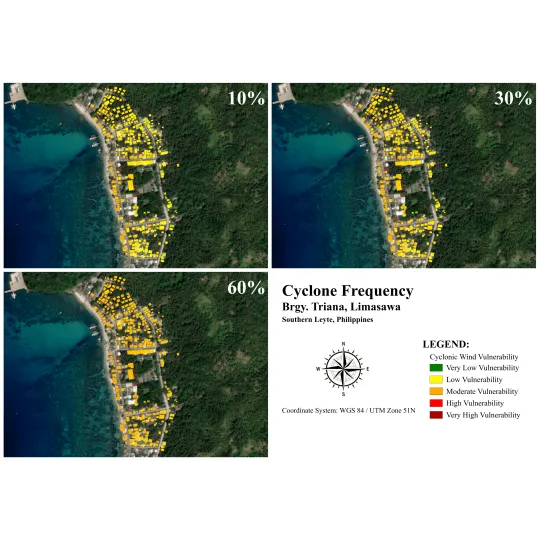
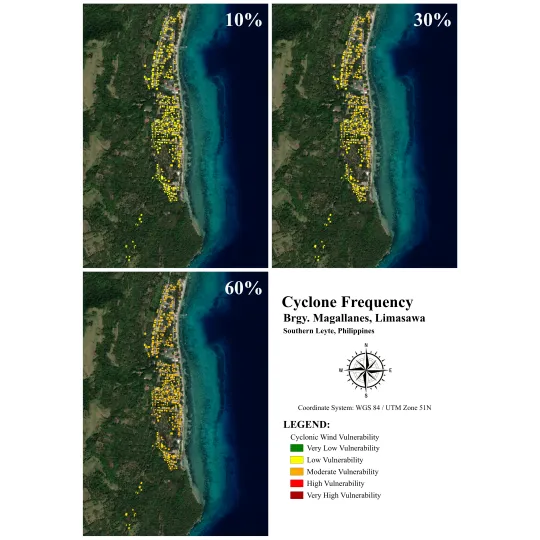
Cyclone Frequency Sensitivity Maps of Brgy. Triana
Sensitivity Graph of Cyclone Frequency (Triana)
Cyclone Frequency Sensitivity Maps of Brgy. Magallanes
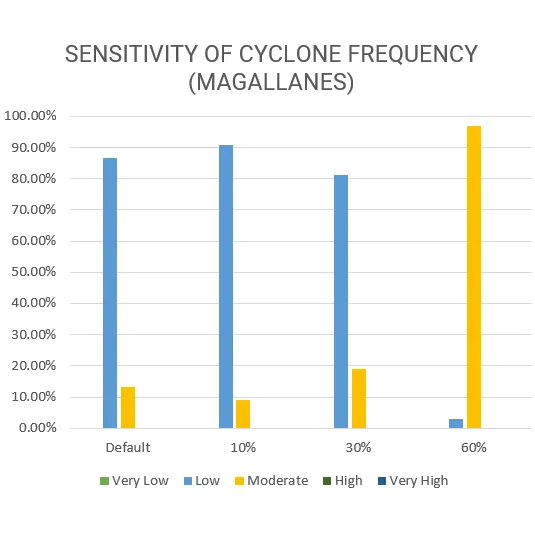
Sensitivity Graph of Cyclone Frequency (Magallanes)
Cyclone Frequency Sensitivity Maps and Graphs
The figures above illustrate the results of processing data for changes in the weight of the cyclone frequency parameter. The analysis reveals a marked decrease in the proportion of houses categorized under low vulnerability across all barangays. Initially, around 73% to 87% of the houses in each barangay fell into this category on the default map. However, when the weight was increased to 60%, this percentage dropped to less than 5% per barangay. Conversely, an increase in the weight assigned to the cyclone frequency parameter led to a rise in the number of houses classified as moderately vulnerable to cyclonic winds. This data underscores the significant impact of changing the weight value of the cyclone frequency parameter on the categorization results.
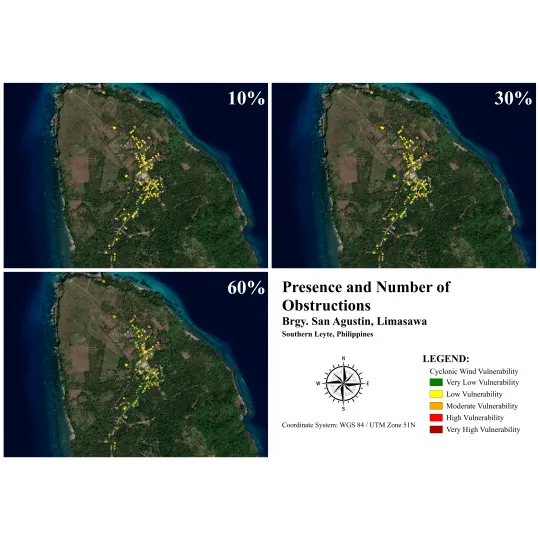
Presence and Number of Obstructions Sensitivity Maps of Brgy. San Agustin
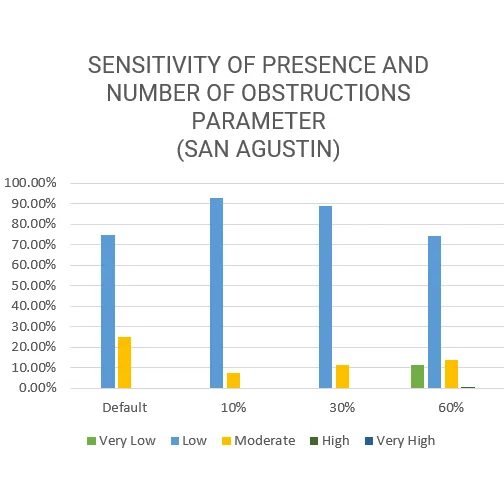
Sensitivity Graph of Presence and Number of Obstructions (San Agustin)
Presence and Number of Obstructions Sensitivity Maps of Brgy. Triana
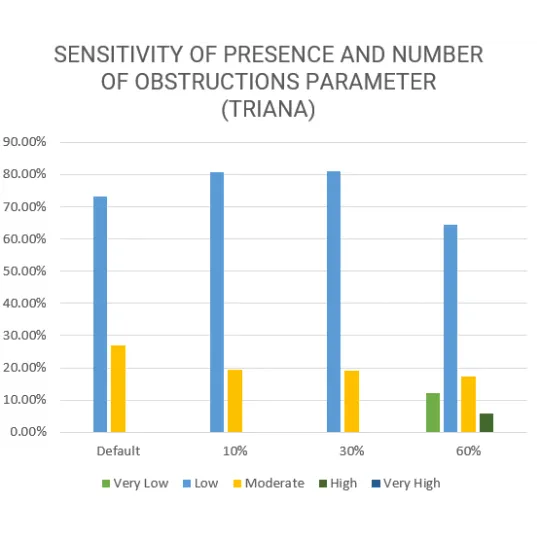
Sensitivity Graph of Presence and Number of Obstructions (Triana)
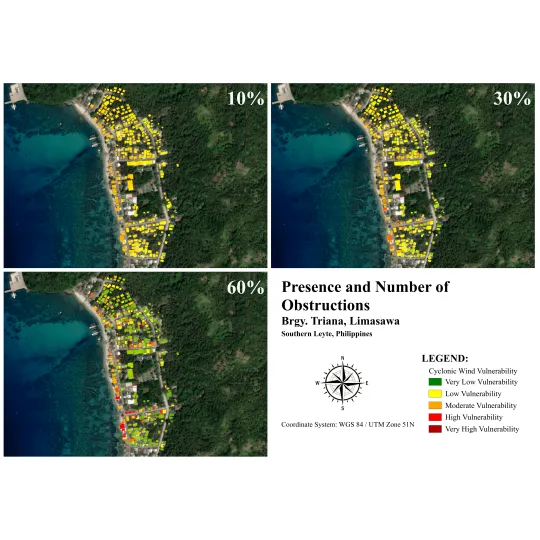
Presence and Number of Obstructions Sensitivity Maps of Brgy. Magallanes
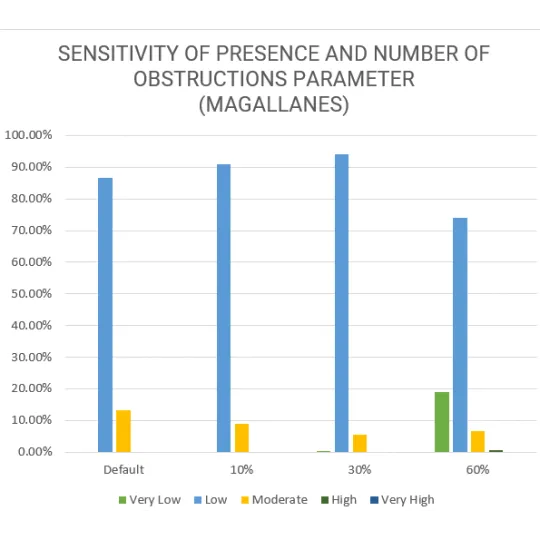
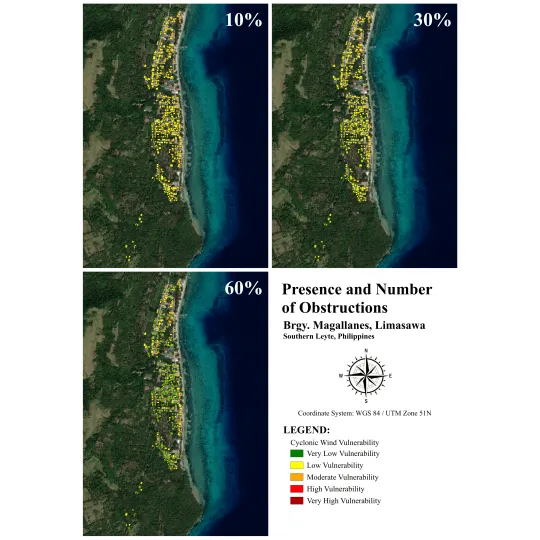
Sensitivity Graph of Presence and Number of Obstructions (Magallanes)
Sensitivity Maps and Graphs of Presence and Number of Obstructions Parameter
The figures illustrate the impact of adjusting weight values for the "presence and number of obstructions" (PNO) parameter on data processing outcomes. Variations in the PNO weight caused significant changes. Notably, the category of low vulnerability consistently remained the most prevalent. When the PNO parameter weight was set to 60%, a new category of houses with very low vulnerability emerged across all barangays. Specifically, this category accounted for 11.26% of houses in Brgy. San Agustin, 12.23% in Brgy. Triana, and 18.97% in Brgy. Magallanes. Meanwhile, in Brgy. Triana, 5.81% of houses fell into the high vulnerability category when the PNO weight was adjusted to 60%, indicating a heightened risk of damage from cyclonic winds.